Analytics Dashboard
DataViz CoDigital Value Unit -- tradeable on Cube
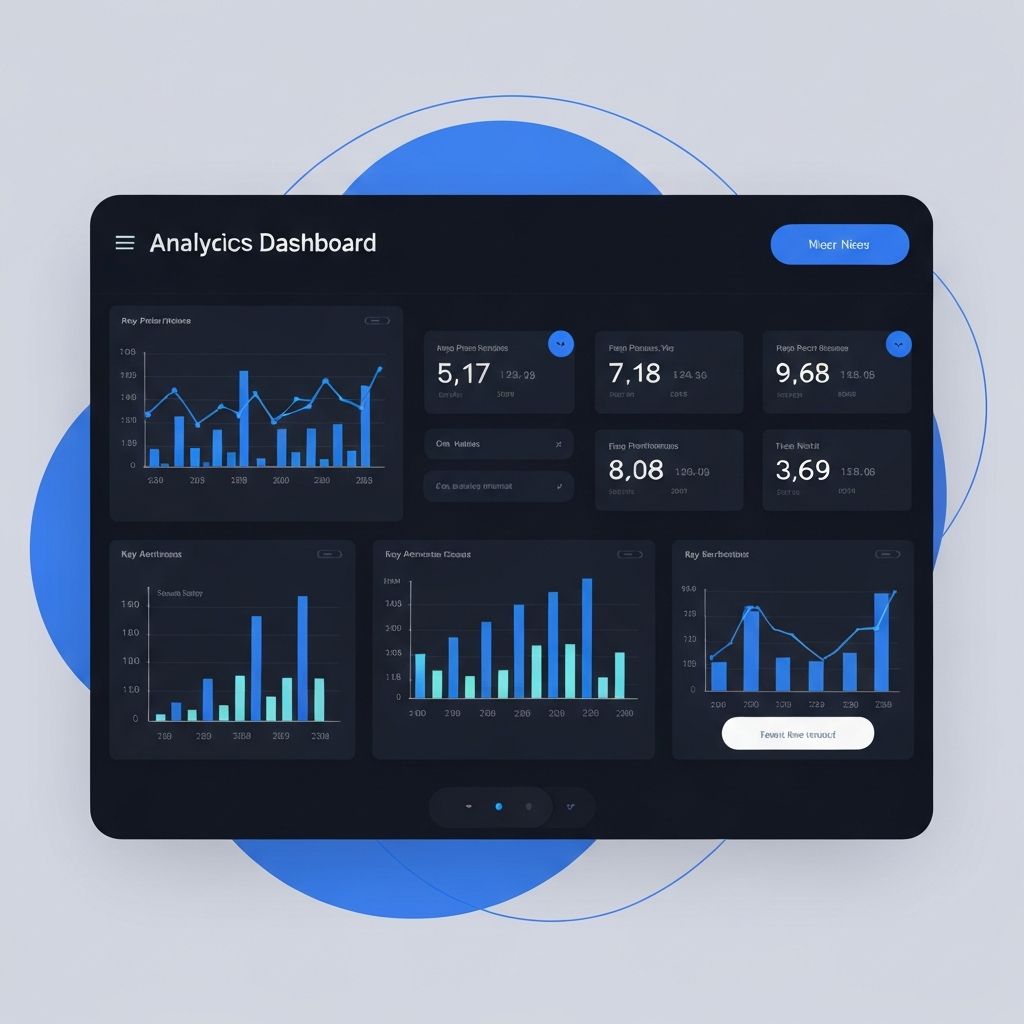
Screenshots

About this app
Analytics Dashboard is the most comprehensive data visualization miniapp on Cube. Built for data-driven teams who need real-time insights at their fingertips. Features include: - 15+ chart types including heatmaps, funnels, and scatter plots - Custom widget builder with drag-and-drop layout - CSV/PDF export for all reports - Real-time data streaming with WebSocket support - Team sharing with role-based access - Slack and Discord integrations - Mobile-responsive dashboards Perfect for startups, agencies, and enterprise teams who want beautiful analytics without the complexity of traditional BI tools.
What's new
v3.2.1Ratings and reviews
Write a reviewGuest
Share your experience
Alex K.
Incredible app! Analytics Dashboard has completely changed how our team works. The UI is clean, fast, and everything just works.
Sarah M.
Really solid. Love the DVU integration and the developer support is responsive. Would love to see more customization options.
James O.
Best in class. I've tried other apps in this category and Analytics Dashboard is by far the most polished. Great work by the team.
Priya D.
The DVU for this app is performing well too. Great product with real value behind it. Highly recommend.
Developer info
Developer
DataViz Co
Website
analytics-dash.cube.app
hello@dataviz.co
Content rating
Everyone
Last updated
Feb 18, 2026
Requires
Cube Runtime 2.0+